Promitor is an Azure Monitor scraper which makes the metrics available to a variety of metric systems such as Atlassian Statuspage, OpenTelemetry, Prometheus and StatsD.

Scraping Azure Monitor metrics
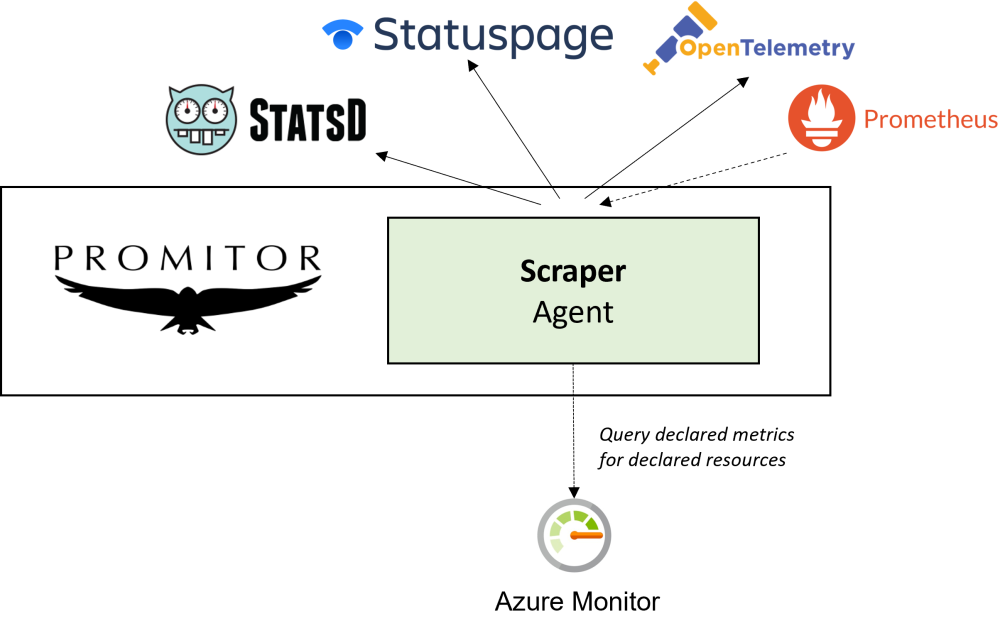
When you want to scrape resources, you can use Promitor Scraper which uses a metrics-as-code approach.
By writing a metric declaration, you will define what Azure Monitor metrics to scrape for a set of Azure resources and to what metric sink(s) they should be reported.
Here’s an overview of how it works:

Using resource discovery
While Promitor Scraper uses a declarative approach for defining Azure resources to scrape; as of Promitor Scraper 2.0 you can integrate with Promitor Resource Discovery!
With resource discovery, you can define resource discovery groups that represent Azure resources of a given type and optionally define criteria for the resources to comply with.
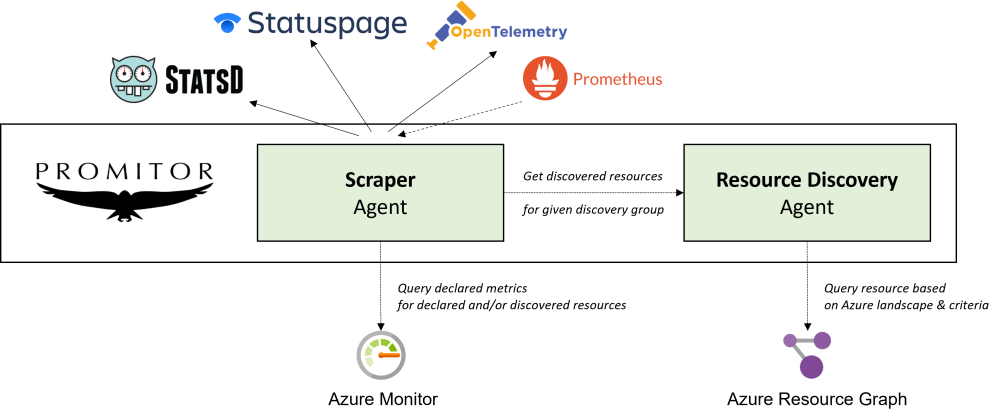
By doing this, you can change your metric declaration for Promitor Scraper so that, instead of using declared resources, reference a resource discovery group which be used to determine what Azure resources it should scrape metrics for.
Behind the scenes, Promitor Resource Discovery integrates with Azure Resource Graph which will query your Azure landscape to discover the corresponding resources.
Here’s an overview of how they work together:

You can easily start discovering resources automatically:
- Declare resource discovery groups (link)
- Deploy Promitor Resource Discovery (link)
- Configure Promitor Scraper to use resource discovery (link)
- Deploy Promitor Scraper (link)
What components do agents provide?
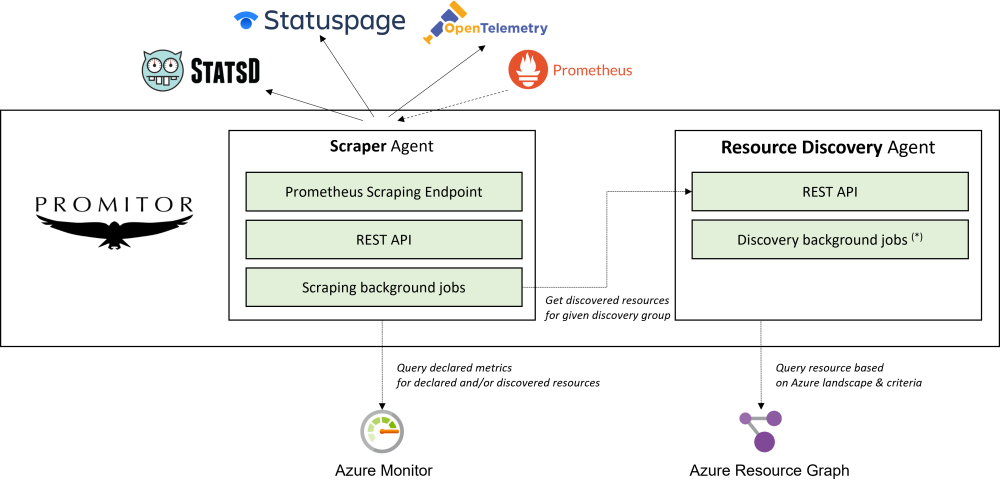
Every Promitor agent provides a REST API which which you can integrate and uses background jobs to acquire the data to reduce latency.
Here’s a detailed overview:

(*) Resources are still discovered synchronously but this will be implemented in Promitor Resource Discovery v0.2.
